 Web Server Statistics for j50.ptechinstitute.com
Program started on Sun, Aug 31 2025 at 8:14 AM.
Analyzed requests from Thu, Jul 10 2025 at 12:23 PM to Sun, Aug 31 2025 at 4:53 AM (51.69 days).
Web Server Statistics for j50.ptechinstitute.comProgram started on Sun, Aug 31 2025 at 8:14 AM.
Analyzed requests from Thu, Jul 10 2025 at 12:23 PM to Sun, Aug 31 2025 at 4:53 AM (51.69 days).
(Go To: Top | General Summary | Monthly Report | Daily Summary | Hourly Summary | Domain Report | Organization Report | Failed Referrer Report | Browser Report | Browser Summary | Operating System Report | Status Code Report | File Size Report | File Type Report | Directory Report | Request Report)
Figures in parentheses refer to the 7-day period ending Aug 31 2025 at 8:14 AM.
Successful requests: 94 (11)
Average successful requests per day: 1 (1)
Successful requests for pages: 87 (11)
Average successful requests for pages per day: 1 (1)
Failed requests: 856 (1)
Distinct files requested: 12 (452)
Distinct hosts served: 70 (94)
Data transferred: 38.09 kilobytes (4.80 kilobytes)
Average data transferred per day: 754 bytes (702 bytes)
(Go To: Top | General Summary | Monthly Report | Daily Summary | Hourly Summary | Domain Report | Organization Report | Failed Referrer Report | Browser Report | Browser Summary | Operating System Report | Status Code Report | File Size Report | File Type Report | Directory Report | Request Report)
Each unit ( ) represents 2 requests for pages or part thereof.
| month | #reqs | #pages | |
|---|---|---|---|
| Jul 2025 | 24 | 24 |   |
| Aug 2025 | 70 | 63 |  |
Busiest month: Aug 2025 (63 requests for pages).
(Go To: Top | General Summary | Monthly Report | Daily Summary | Hourly Summary | Domain Report | Organization Report | Failed Referrer Report | Browser Report | Browser Summary | Operating System Report | Status Code Report | File Size Report | File Type Report | Directory Report | Request Report)
Each unit () represents 1 request for a page.
| day | #reqs | #pages | |
|---|---|---|---|
| Sun | 10 | 10 |  |
| Mon | 6 | 6 | |
| Tue | 9 | 9 | |
| Wed | 5 | 5 | |
| Thu | 30 | 23 |  |
| Fri | 20 | 20 | |
| Sat | 14 | 14 | |
(Go To: Top | General Summary | Monthly Report | Daily Summary | Hourly Summary | Domain Report | Organization Report | Failed Referrer Report | Browser Report | Browser Summary | Operating System Report | Status Code Report | File Size Report | File Type Report | Directory Report | Request Report)
Each unit () represents 1 request for a page.
| hour | #reqs | #pages | |
|---|---|---|---|
| 0 | 3 | 3 | |
| 1 | 5 | 5 | |
| 2 | 4 | 4 | |
| 3 | 3 | 3 | |
| 4 | 4 | 4 | |
| 5 | 0 | 0 | |
| 6 | 7 | 7 | |
| 7 | 8 | 8 | |
| 8 | 6 | 6 | |
| 9 | 14 | 7 | |
| 10 | 3 | 3 | |
| 11 | 2 | 2 | |
| 12 | 4 | 4 | |
| 13 | 3 | 3 | |
| 14 | 2 | 2 | |
| 15 | 2 | 2 | |
| 16 | 5 | 5 | |
| 17 | 0 | 0 | |
| 18 | 3 | 3 | |
| 19 | 3 | 3 | |
| 20 | 2 | 2 | |
| 21 | 5 | 5 | |
| 22 | 1 | 1 | |
| 23 | 5 | 5 | |
(Go To: Top | General Summary | Monthly Report | Daily Summary | Hourly Summary | Domain Report | Organization Report | Failed Referrer Report | Browser Report | Browser Summary | Operating System Report | Status Code Report | File Size Report | File Type Report | Directory Report | Request Report)
Listing domains, sorted by the amount of traffic.
| #reqs | %bytes | domain |
|---|---|---|
| 94 | 100% | [unresolved numerical addresses] |
(Go To: Top | General Summary | Monthly Report | Daily Summary | Hourly Summary | Domain Report | Organization Report | Failed Referrer Report | Browser Report | Browser Summary | Operating System Report | Status Code Report | File Size Report | File Type Report | Directory Report | Request Report)
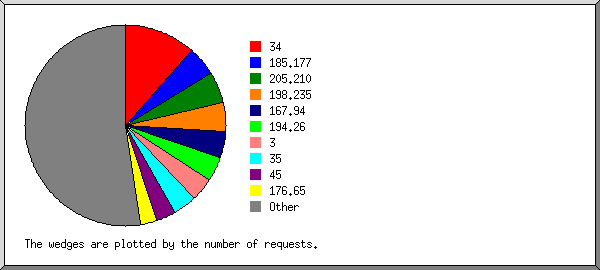
Listing the top 20 organizations by the number of requests, sorted by the number of requests.
| #reqs | %bytes | organization |
|---|---|---|
| 10 | 11.46% | 185.177 |
| 9 | 10.31% | 167.94 |
| 8 | 8.25% | 34 |
| 7 | 8.02% | 198.235 |
| 6 | 6.88% | 101 |
| 6 | 6.88% | 205.210 |
| 5 | 4.81% | 13 |
| 4 | 3.66% | 18 |
| 4 | 4.58% | 164.92 |
| 3 | 3.44% | 91 |
| 3 | 3.44% | 123 |
| 2 | 0.33% | 216.10 |
| 2 | 1.15% | 192.64 |
| 2 | 2.29% | 206.168 |
| 2 | 2.29% | 147.185 |
| 2 | 2.29% | 3 |
| 2 | 2.29% | 64.227 |
| 2 | 2.29% | 199.45 |
| 1 | 1.15% | 159.223 |
| 1 | 1.15% | 157.245 |
| 13 | 13.05% | [not listed: 13 organizations] |
(Go To: Top | General Summary | Monthly Report | Daily Summary | Hourly Summary | Domain Report | Organization Report | Failed Referrer Report | Browser Report | Browser Summary | Operating System Report | Status Code Report | File Size Report | File Type Report | Directory Report | Request Report)
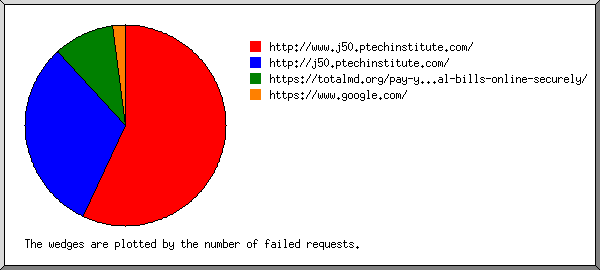
Listing referring URLs, sorted by the number of failed requests.
| #reqs | URL |
|---|---|
| 6 | http://www.j50.ptechinstitute.com/ |
| 4 | http://j50.ptechinstitute.com/ |
(Go To: Top | General Summary | Monthly Report | Daily Summary | Hourly Summary | Domain Report | Organization Report | Failed Referrer Report | Browser Report | Browser Summary | Operating System Report | Status Code Report | File Size Report | File Type Report | Directory Report | Request Report)

Listing browsers with at least 1 request for a page, sorted by the number of requests for pages.
| #reqs | #pages | browser |
|---|---|---|
| 13 | 13 | Mozilla/5.0 (compatible; CensysInspect/1.1; +https://about.censys.io/) |
| 10 | 10 | Hello from Palo Alto Networks, find out more about our scans in https://docs-cortex.paloaltonetworks.com/r/1/Cortex-Xpanse/Scanning-activity |
| 9 | 9 | Mozilla/5.0 (Windows NT 10.0; Win64; x64) AppleWebKit/537.36 (KHTML, like Gecko) Chrome/78.0.3904.108 Safari/537.36 |
| 8 | 8 | Mozilla/5.0 (Windows NT 10.0; Win64; x64) AppleWebKit/537.36 (KHTML, like Gecko) Chrome/91.0.4472.124 Safari/537.36 |
| 6 | 6 | Mozilla/5.0 (X11; Linux x86_64) AppleWebKit/537.36 (KHTML, like Gecko) Chrome/137.0.0.0 Safari/537.36 |
| 6 | 6 | Mozilla/5.0 (Macintosh; Intel Mac OS X 10_7_0) AppleWebKit/535.11 (KHTML, like Gecko) Chrome/17.0.963.56 Safari/535.11 |
| 3 | 3 | Mozilla/5.0 (compatible; CMS-Checker/1.0; +https://example.com) |
| 3 | 3 | Mozilla/5.0 (Macintosh; Intel Mac OS X 10_15_7) AppleWebKit/537.36 (KHTML, like Gecko) Chrome/120.0.0.0 Safari/537.36 Edg/120.0.0.0 |
| 2 | 2 | Mozilla/5.0 (X11; Linux x86_64) AppleWebKit/537.36 (KHTML, like Gecko) Chrome/139.0.0.0 Safari/537.36 |
| 2 | 2 | Mozilla/5.0 (Windows NT 10.0; Win64; x64) AppleWebKit/537.36 (KHTML, like Gecko) Chrome/104.0.0.0 Safari/537.36 |
| 2 | 2 | Mozilla/5.0 (X11; Linux x86_64; rv:139.0) Gecko/20100101 Firefox/139.0 |
| 2 | 2 | python-httpx/0.28.1 |
| 2 | 2 | Mozilla/5.0 (compatible; InternetMeasurement/1.0; +https://internet-measurement.com/) |
| 1 | 1 | Mozilla/5.0 (Windows NT 10.0; Win64; x64) AppleWebKit/537.36 (KHTML, like Gecko) Chrome/89.0.4389.90 Safari/537.36 Edge/89.0.774.57 |
| 1 | 1 | Mozilla/5.0 zgrab/0.x |
| 1 | 1 | Mozilla/5.0 (X11; Linux i686) AppleWebKit/537.36 (KHTML, like Gecko) Ubuntu Chromium/51.0.2704.79 Chrome/51.0.2704.79 Safari/537.36 |
| 1 | 1 | Mozilla/5.0 (compatible; NetcraftSurveyAgent/1.0; +info@netcraft.com) |
| 1 | 1 | Go-http-client/1.1 |
| 1 | 1 | Mozilla/5.0 (Macintosh; Intel Mac OS X 10_14_3) AppleWebKit/537.36 (KHTML, like Gecko) Chrome/73.0.3683.103 Safari/537.36 |
| 1 | 1 | Mozilla/5.0 (Windows NT 10.0; Win64; x64) AppleWebKit/537.36 (KHTML, like Gecko) Chrome/122.0.0.0 Safari/537.36 Edg/122.0.0.0 |
| 1 | 1 | Mozilla/5.0 (Windows NT 10.0; Win64; x64) AppleWebKit/537.36 (KHTML, like Gecko) Chrome/58.0.3029.110 Safari/537.36 |
| 1 | 1 | Mozilla/5.0 (Windows NT 10.0; Win64; x64) AppleWebKit/537.36 (KHTML, like Gecko) Chrome/123.0.0.0 Safari/537.36 Edg/123.0.0.0 |
| 1 | 1 | Mozilla/5.0 (Macintosh; Intel Mac OS X 10_15_7) AppleWebKit/537.36 (KHTML, like Gecko) Chrome/115.0.5790.102 Safari/537.36 |
| 1 | 1 | Mozilla/5.0 (Linux; Android 6.0; HTC One M9 Build/MRA599705) AppleWebKit/537.36 (KHTML, like Gecko) Chrome/52.0.3624.98 Mobile Safari/537.3 |
| 1 | 1 | Mozilla/5.0 (Windows NT 6.1; WOW64; rv:60.0) Gecko/20100101 Firefox/60.0 |
| 1 | 1 | Mozilla/5.0 AppleWebKit/537.36 (KHTML, like Gecko; compatible; Googlebot/2.1; +http://www.google.com/bot.html) Chrome/120.0.6099.199 Safari/537.36 |
| 7 | 0 | [not listed: 2 browsers] |
(Go To: Top | General Summary | Monthly Report | Daily Summary | Hourly Summary | Domain Report | Organization Report | Failed Referrer Report | Browser Report | Browser Summary | Operating System Report | Status Code Report | File Size Report | File Type Report | Directory Report | Request Report)

Listing browsers with at least 1 request for a page, sorted by the number of requests for pages.
| # | #reqs | #pages | browser |
|---|---|---|---|
| 1 | 45 | 45 | Safari |
| 39 | 39 | Safari/537 | |
| 6 | 6 | Safari/535 | |
| 2 | 24 | 19 | Netscape (compatible) |
| 3 | 10 | 10 | Hello from Palo Alto Networks, find out more about our scans in https: |
| 10 | 10 | Hello from Palo Alto Networks, find out more about our scans in https://docs-cortex | |
| 4 | 3 | 3 | Firefox |
| 2 | 2 | Firefox/139 | |
| 1 | 1 | Firefox/60 | |
| 5 | 2 | 2 | python-httpx |
| 2 | 2 | python-httpx/0 | |
| 6 | 1 | 1 | Mozilla |
| 7 | 1 | 1 | Go-http-client |
| 1 | 1 | Go-http-client/1 | |
| 2 | 0 | [not listed: 1 browser] |
(Go To: Top | General Summary | Monthly Report | Daily Summary | Hourly Summary | Domain Report | Organization Report | Failed Referrer Report | Browser Report | Browser Summary | Operating System Report | Status Code Report | File Size Report | File Type Report | Directory Report | Request Report)

Listing operating systems, sorted by the number of requests for pages.
| # | #reqs | #pages | OS |
|---|---|---|---|
| 1 | 41 | 34 | OS unknown |
| 2 | 24 | 24 | Windows |
| 23 | 23 | Windows NT | |
| 1 | 1 | Unknown Windows | |
| 3 | 12 | 12 | Unix |
| 12 | 12 | Linux | |
| 4 | 11 | 11 | Macintosh |
(Go To: Top | General Summary | Monthly Report | Daily Summary | Hourly Summary | Domain Report | Organization Report | Failed Referrer Report | Browser Report | Browser Summary | Operating System Report | Status Code Report | File Size Report | File Type Report | Directory Report | Request Report)

Listing status codes, sorted numerically.
| #reqs | status code |
|---|---|
| 94 | 200 OK |
| 856 | 404 Document not found |
(Go To: Top | General Summary | Monthly Report | Daily Summary | Hourly Summary | Domain Report | Organization Report | Failed Referrer Report | Browser Report | Browser Summary | Operating System Report | Status Code Report | File Size Report | File Type Report | Directory Report | Request Report)
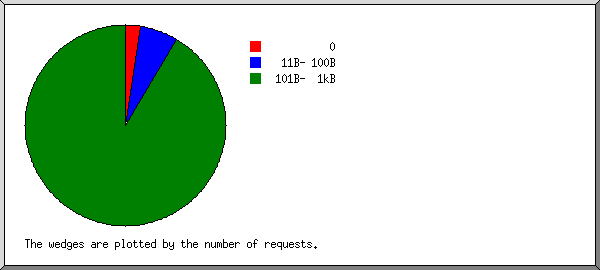
| size | #reqs | %bytes |
|---|---|---|
| 0 | 1 | |
| 1B- 10B | 0 | |
| 11B- 100B | 7 | 1.44% |
| 101B- 1kB | 86 | 98.56% |
(Go To: Top | General Summary | Monthly Report | Daily Summary | Hourly Summary | Domain Report | Organization Report | Failed Referrer Report | Browser Report | Browser Summary | Operating System Report | Status Code Report | File Size Report | File Type Report | Directory Report | Request Report)

Listing extensions with at least 0.1% of the traffic, sorted by the amount of traffic.
| #reqs | %bytes | extension |
|---|---|---|
| 87 | 98.56% | [directories] |
| 7 | 1.44% | [no extension] |
(Go To: Top | General Summary | Monthly Report | Daily Summary | Hourly Summary | Domain Report | Organization Report | Failed Referrer Report | Browser Report | Browser Summary | Operating System Report | Status Code Report | File Size Report | File Type Report | Directory Report | Request Report)
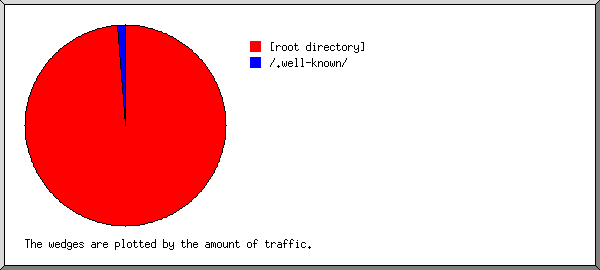
Listing directories with at least 0.01% of the traffic, sorted by the amount of traffic.
| #reqs | %bytes | directory |
|---|---|---|
| 87 | 98.56% | [root directory] |
| 7 | 1.44% | /.well-known/ |
(Go To: Top | General Summary | Monthly Report | Daily Summary | Hourly Summary | Domain Report | Organization Report | Failed Referrer Report | Browser Report | Browser Summary | Operating System Report | Status Code Report | File Size Report | File Type Report | Directory Report | Request Report)

Listing files with at least 20 requests, sorted by the number of requests.
| #reqs | %bytes | last time | file |
|---|---|---|---|
| 87 | 98.56% | Aug/29/25 8:54 PM | / |
| 7 | 1.44% | Aug/ 7/25 9:31 AM | [not listed: 3 files] |